Posted on March 7, 2013 by Tony Welsh
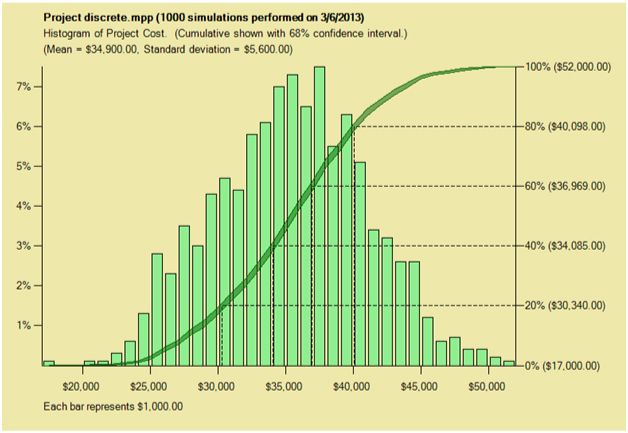
Some of you may have noticed that the illustrations in this blog post were all based upon 1 million iterations, or trials. I did this to ensure that the histograms produced were nice and smooth, but this number is overkill for most practical purposes. However, it is essential to do a sufficient number of trials to get reliable results. This in turn means that the speed of your risk analysis software is critical, especially if you are dealing with a large network.
How many trials is sufficient depends upon what we want to know. Typically we want to know the probability of completing the project (or of achieving a particular milestone) by a certain date or for a certain cost. The reliability of such an estimate will depend upon the number of trials we do.
To establish how the number of trials affects the reliability of our estimates, first consider just one trial. There are only two possibilities – the date either will or won’t be met – so we can represent the result as a number which is either 1 (if we meet the date) or 0 (if we don’t). The distribution of such a binary value is known as the binomial distribution and it is fairly easy to show that the variance (the square of the standard deviation) of this value is p times (1-p).
Now consider doing a number of trials. Since variances are additive, the variance of the total of n trials is n times p times (1-p) and the standard deviation is the square root of this. Thus the standard deviation of our estimate is given by
Let us suppose that this estimate is 0.8. Then the above formula gives us the following errors for different values of n:
| Trials | Error |
|---|---|
| 10 | 0.1265 |
| 100 | 0.0400 |
| 1000 | 0.0126 |
| 10000 | 0.0040 |
Of course we do not actually know the value of p. Fortunately the formula is not very sensitive to the exact value of p, so if n is not too small we can use an estimate of p. In the above example, if we did 100 trials and 72 of them met the date, our estimate of p would be 0.72 and the estimated value of our error would be would be 0.045.
For most purposes an error of around 0.01 should be acceptable, so between 1000 and 10,000 iterations should be enough. Note however that this will not guarantee nice smooth histograms of the sort obtained using 100,000 or more iterations.
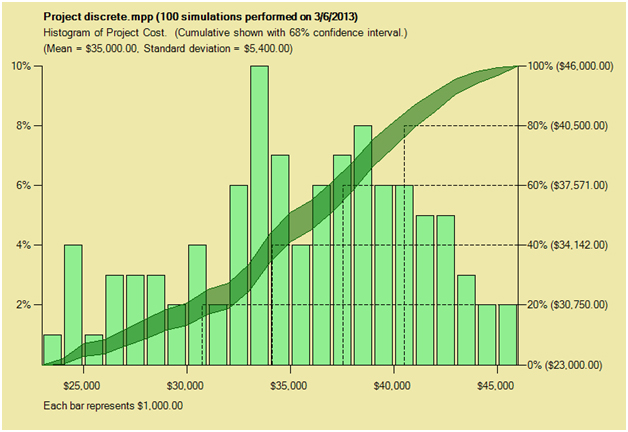
Also note that if we turn the question around, so that instead of wanting to know the probability of meeting a particular date we want to know the date which we have an 80% chance of meeting, often called the “P80” point, the above does not help much. The standard error in the date depends upon the slope of the cumulative distribution function at that point. Full Monte does have an option to show a confidence interval around this curve. In the example below, it is set to 68% which corresponds approximately to one standard deviation each side of the estimate. (This example relates to cost, but it works the same for dates.) If this range is looked at in the vertical direction it agrees with the calculations above, but because the binomial points are interpolated one can also read off in the horizontal direction the error in our estimate of the P80 point.