Full Monte Features

  • Support for normal, lognormal, beta, triangular, and uniform duration uncertainty distributions.
  • Probabilistic and conditional branching.
  • Task Existence Probability that can be linked to Probability of Occurrence for discrete risks.
  • Correlations between task durations and resource cost rates based upon multiple external factors.
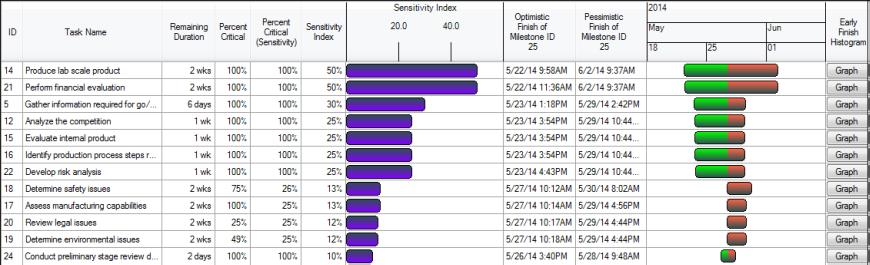
  • Sensitivity analysis, including sensitivity index, and tornado charts for cost and schedule.
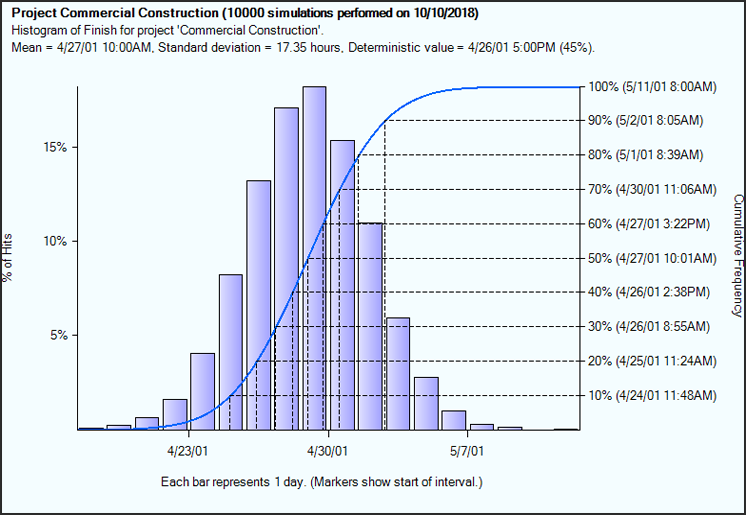
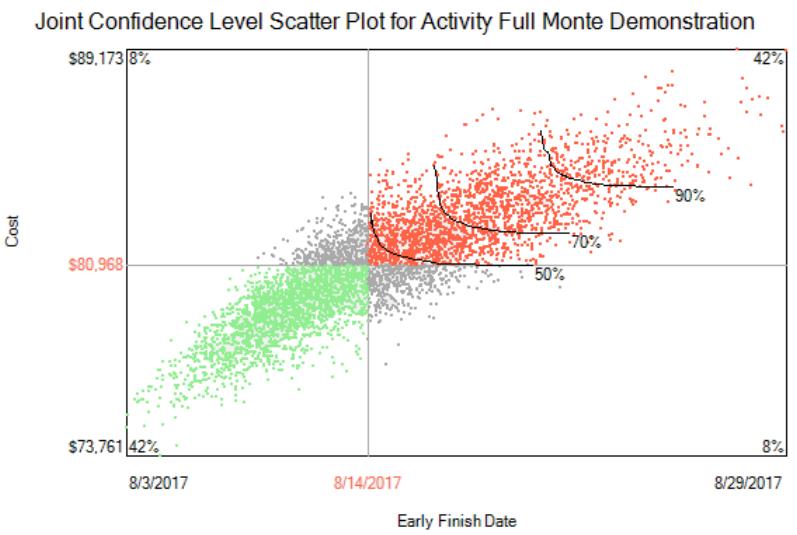
  • Expected values, standard deviations, percentiles, histograms, and s-curves for dates and costs for all tasks.
  • True cost integration is achieved by resource-loading the schedule as required by AACE Recommended Practice 57R-09.
  • Active percentage, critical percentage, sensitivity index, merge bias delay for every task.
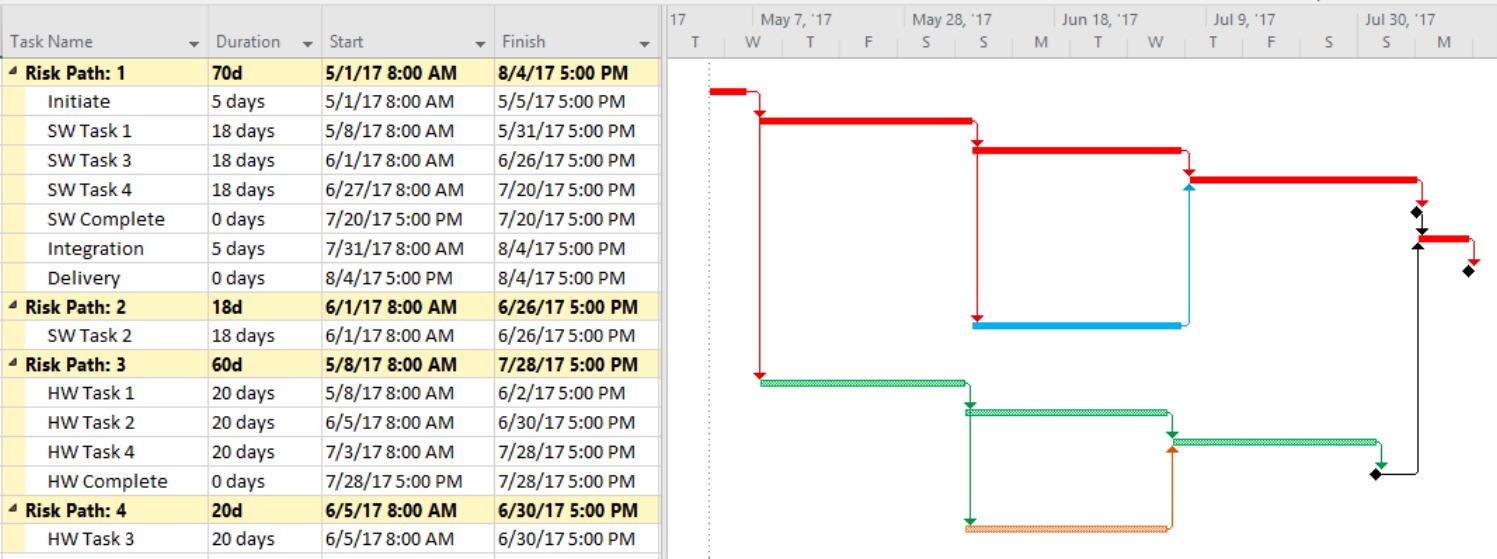
  • Supports linked projects.
  • Automatically save selected results to custom user fields.
  • Easy to use (no VBA or other programming required).
  • Sophisticated modeling of calendar uncertainty to model weather effects (P6 version only).
  • Diagnostic fields to explain the basis for results.

Avoid awkward Import/Export

Full Monte runs against your source schedule in either Microsoft Project or Oracle Primavera. This avoids the possibility of performing your analysis on an out-of-date schedule and ensures that your uncertainty data is backed up with your standard procedures.

Full Monte can display risk adjusted schedules based on any required level of confidence along with Tornado charts, joint cost/schedule scatter plots and the traditional histograms and S-curves

Sensitivity Analysis

Sensitivity analysis pinpoints those tasks or outside influences which most critically affect the finish date and cost of the project, or part of the project.
The split bars highlight both positive and negative influences for the various tasks. The green bar shows how the project is influenced to finish early when a task finishes early. Likewise, red bars indicate the project was influenced to finish late when a task finishes late. This helps identify opportunities for schedule compression.

“Tornado chart” showing the sensitivity of an interim delivery milestone to uncertainty of preceding work. Note the columns showing ‘Percent Critical’ and ‘Percent Critical (Sensitivity)’ which show the criticality of the various tasks to both project completion and interim milestone respectively.

Risk Path Analysis

Risk Path Analysis identifies the potential critical paths to either project completion or a selected milestone.

“Risk Path Gantt” showing the potential critical paths to any selected deliverable based on their criticality to the outcome. This example uses Full Monte data sharing with the host scheduling tool to create the view.

Joint Confidence Level (JCL)

The JCL scatter report is an integrated uncertainty analysis of both cost and schedule. It shows the probability of both cost and schedule being within target values and highlights the relationship between the two.

Monte Carlo Simulation

Full Monte uses Monte Carlo simulation – named after the famous casino – to produce more realistic schedules by modeling the uncertainties inherent in any prediction of the future. Monte Carlo works by simulating the project thousands of times, each time using a different set of duration estimates sampled from distributions specified by you. Results are presented in terms of histograms and S-curves of both schedule and cost for every task in the schedule.

Supported Environments

Full Monte for Microsoft Project

Microsoft Project 2010 through 2021 Standard or Professional Editions, 32 or 64bit.
Office 365 with local install. Project Server/Online supported with Microsoft Project Professional.

Full Monte SRA Contractor Edition for Primavera P6

Primavera P6 SQLite databases from P6 8.4 through P6 23.12.

Windows 7 SP1 (32 or 64bit), Windows 10 (64bit), Windows 11 (64bit)